A Closer Look At Advanced CODAS Software
Advanced CODAS is a seamless software enhancement to WinDaq Waveform Browser playback and analysis software. Essentially a tool box of analysis functions, Advanced CODAS offers almost limitless flexibility in its approach to waveform analysis. This application note seeks to examine each Advanced CODAS analysis function in detail in an attempt to equip its reader with an understanding of analysis principles that may be applied in his or her own application. The waveform examples used in the following pages were tapped from the large pool of WinDaq software users. But, the applications they represent should not be interpreted as limiting the potential use of the product in other areas. Such limitations in any given situation are a function of the analysis utilities themselves and the imagination of the user.
It is important to emphasize that all Advanced CODAS analysis functions operate as true disk streamers. Acquired waveform information is streamed from disk, through the analysis function, and back to the disk as a calculated channel. The quantity of data you can analyze is limited only by the size of your hard drive. Further, all waveforms generated by Advanced CODAS are automatically calibrated to the appropriate unit of measure.
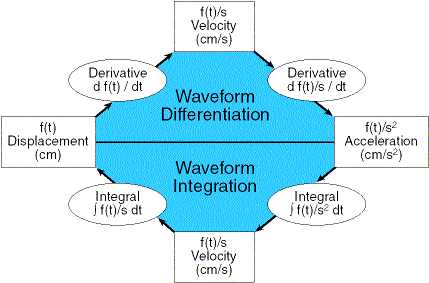
The calculus functions of Advanced CODAS, Integral and Derivative, allow flexible unit transformations. The same principles demonstrated in the above example may be applied to virtually any unit of measure encountered in medical or industrial applications.
WAVEFORM INTEGRATION — For Area-Under-The-Curve Determinations
- Reduces the complex function k ∫ f(t) dt to a simple maneuver
- Four input modes:
- Absolute Value — folds negative signals above zero to join positive signals before integration (full-wave rectification)
- Bipolar — integrates signals above and below zero
- Positive Unipolar — blocks signals below zero from being integrated (+ half-wave rectification)
- Negative Unipolar — blocks signals above zero from being integrated (- half-wave rectification)
- Automatic scaling allows calibration in any unit of measure related to time in seconds.
- Four reset methods allow periodic integral reset without manual intervention:
- Zero Crossing — resets the accumulated area to zero each time the signal passes through zero.
- Time — resets the accumulated area to zero at a preset time
- Level — resets the accumulated area to zero at a specified value of area
- External — resets the accumulated area to zero from the peak-capture-markers of another channel
- Two display modes:
- Continuous — continuously displays integrated waveform
- Sample and Hold Before Reset — eliminates zero reset transitions while holding total accumulated area until the next reset
The integral function generates the area-under-the-curve of an input channel. Unique to Advanced CODAS is its ability to generate a "continuous" integrated waveform channel. No other software package provides the integrator reset methods that allow a continuous, unbroken, automatic display of an integrated waveform. Four methods of integration reset are available: on zero-crossing of the input channel, at specific time intervals, upon a specific level of calculated area, or externally from another channel that has been marked with inflection points by the Advanced CODAS Peak capture algorithm.
Figure 2 illustrates the different input modes using the zero-crossing reset method for all cases. The input signal of Figure 1 is a respiratory waveform obtained from an air flow transducer or pneumotach. The respiratory volume window of Figure 2 shows the generation of the inspiratory/ expiratory volume waveform calculated from respiratory flow. The respiratory volume window was setup to integrate signals above and below zero (bipolar) and reset on every zero-crossing of the input signal channel.
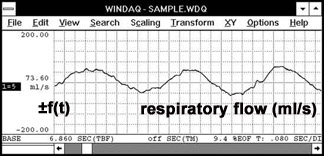
Figure 1 — This respiratory flow waveform will serve as the input signal for the integral function and can be described mathematically as ±f(t).
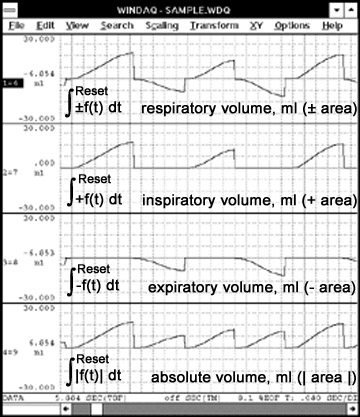
Figure 2 — Illustrates the four input modes of the Advanced CODAS integral function using the zero-crossing reset method in all four cases.
The setup for inspiratory volume was the same as the respiratory volume channel except the integrator rectification mode was set for positive signals only. Each positive peak of the triangle-like waveform of the inspiratory volume channel is the total accumulated air volume inhaled. The expiratory volume channel was setup for negative signals only. The absolute volume channel shows the resulting waveform when the integrator rectification mode was set for absolute value (negative signals folded above zero to join the positive signals).
Figure 3 illustrates the level and time reset methods of integration, as well as the use of sample/hold to generate a histogram-like display of peak integral values. The volume per breath window shows the peak values of breath-by-breath inspiratory volumes. Its setup is identical to the top window (inspiratory volume), but with sample/hold activated. The volume per time window illustrates the reset of the integral every 0.8 seconds. The time per volume window shows the use of level reset. In this case, reset occurs when the inspiratory volume reaches a predetermined volume of 40 milliliters.
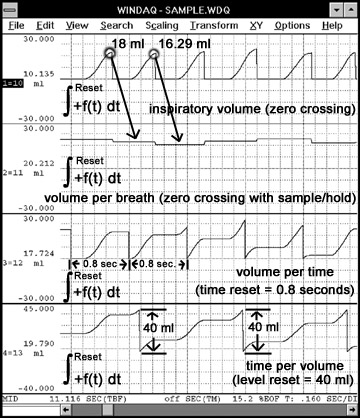
Figure 3 — Illustrates the Advanced CODAS integral function reset methods. All four cases show the positive unipolar mode.
WAVEFORM RECTIFICATION — For Rectified View Of Any Input Waveform
- Three presentation modes:
- Absolute Value — folds negative signals above zero to join positive signals (full-wave rectification)
- Positive Unipolar — blocks signals below zero (+ half-wave rectification)
- Negative Unipolar — blocks signals above zero (- half-wave rectification)
The rectifier section of the integral is available as a separate function and allows input channels to be half-wave or full-wave rectified.
Figure 4 shows the effect of rectification on a respiratory flow waveform. The inspiratory flow channel is the positive half of the signal extracted from respiratory flow. Inspiratory flow was generated by selecting "Positive Unipolar", which blocks all negative signals from being displayed. The expiratory flow channel shows the effects of selecting "Negative Unipolar" from the respiratory flow channel which blocks all positive signals. The absolute flow channel is a display of the "Absolute Value" of respiratory flow, which folds the negative signals above zero to join the positive signals.
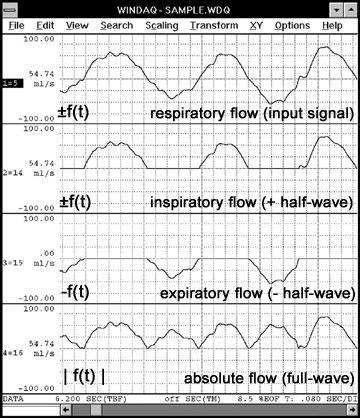
Figure 4 — Illustrates the Advanced CODAS rectification function on a respiratory flow waveform.
WAVEFORM PEAK AND VALLEY CAPTURE — For Detecting Cyclic Minimum And Maximum Points
- Automatically peak captures each cycle of an input waveform for maximum (peak) and/or minimum (valley) excursions
- Achieves at least a 40:1 reduction of data ported to an analysis package by the Advanced CODAS Report Generator
- Operates on WinDaq-acquired or Advanced CODAS-calculated channels
- Operates over an unlimited number of waveform cycles
- Variable threshold detector works with virtually any industrial or medical class waveform
- Configurable for peak, valley, or peak and valley detection
- Places easily identifiable peak and valley markers on input waveform
- Allows peak and valley marker review and editing from WinDaq Waveform Browser playback and analysis software
An inherent characteristic of computer-based data acquisition is the ability to generate large data files of waveform information. This is especially true of WinDaq systems with their unique ability to continuously record waveform information to disk. Unfortunately, waveform analysis utilities such as ASYST and Lotus 1-2-3 are extremely limited in the quantity of acquired data that can be imported. Further, waveform analysis often begins with a determination of the maximum and minimum waveform excursions within a defined cycle. These quantities are automatically derived by the Advanced CODAS Peak Capture utility. It detects critical periodic maximum and/or minimum waveform excursions and, in tandem with the Report Generator (see next section), reduces a waveform stream to its component cycle-by-cycle elements: Peak and Valley excursion values with mean and timing information in any unit of measure. Reporting reduced data to your favorite analysis package expands its capacity by at least 40 times, while allowing you to concentrate on analysis and final presentation.
Example — Peak Detecting an Arterial Pressure Waveform to Extract Systolic, Diastolic, and Mean Pressures and Heart Rate.
Advanced CODAS Operations:
Peak and valley capture of an arterial pressure waveform for minimum (diastolic) and maximum (systolic) inflection points.
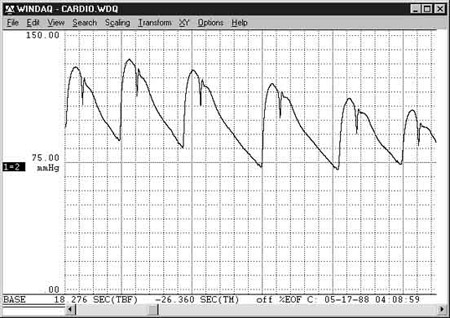
Input waveform: arterial pressure (mmHg).
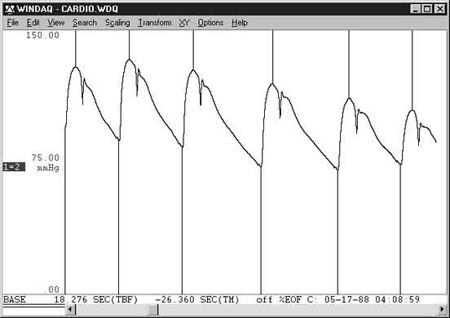
Peak and valley captured waveform (shown with grid lines disabled for clarity). The peak detected data points indicate systolic pressure and the valley detected data points indicate diastolic pressure.
WAVEFORM REPORT GENERATOR — For Report Generation Of Peak Captured Waveforms
- Reports the peak and/or valley points of a peak captured waveform in the waveform's unit of measure
- Derives and reports cycle-by-cycle waveform mean (area under the curve divided by time) and timing values
- Reports peak and valley sample numbers for X-Y plotting
- Accepts four cycle definitions: valley-to-valley; peak-to-peak; valley-to-peak; peak-to-valley
- Automatically and fully comments each report
- Selectable scaling for timing values: interval in seconds; rate in Hertz; and rate in cycles per minute
- Supports two output data formats: tabular ASCII reals (accepted by all spreadsheets); ASYST- and ASYSTANT-compatible floating point binary
- Performs cycle-by-cycle averaging of reported values in selectable groups of 1 (no averaging), to 32,767 cycles
The Advanced CODAS Report Generator (RG) accepts a waveform that was peak captured using the Advanced CODAS Peak Capture utility (see previous section), and generates a report of peak and/or valley points in the waveform's unit of measure. RG contains algorithms that allow it to further report mean value and timing information. Mean values, derived by calculating the area under the curve divided by time, are reported in the waveform's unit of measure on a cycle-by-cycle basis. Waveform cycle timing may be reported as an interval in seconds, or as a rate in Hertz or as a rate in cycles per minute. Also provided are the sample numbers of reported peak and valley points allowing each point-value to be plotted versus time by an analysis package. Designed for flexibility, RG allows you to specify point-value reporting on a cycle-by-cycle, or up to a 32,767-cycle average basis. It supports the data storage format of all popular spreadsheets and text editors (e.g., Lotus 1-2-3, Quatro, PC-Write, Microsoft Word, etc.) as well as scientific analysis packages ASYST and ASYSTANT. Used in combination with the Advanced CODAS Peak Capture utility, RG files put your favorite analysis package to work by allowing you to spend more time analyzing as opposed to extracting waveform information.
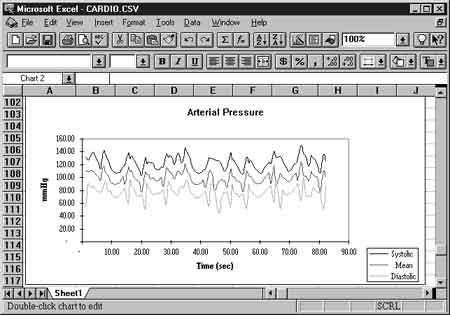
Report Generator Operations:
Generate a report of peak and valley captured pressure specifying spreadsheet print file (CS V) output format. Plot beat-by-beat systolic, diastolic, and mean pressure vs. time (in seconds). The underlying data used to generate this graph includes heart rate, but it was not plotted.
WAVEFORM DIFFERENTIATION — For Rate-Of-Change Determinations
- Reduces the complex function kd [f(t)]/dt to a simple maneuver
- Variable balanced filtering eliminates phase shifting of output vs. input waveforms
- Automatic scaling allows calibration in any unit of measure related to time in seconds
The derivative function derives the rate-of-change of an input channel. Unique to the derivative is the ability to apply a balanced moving average filter directly to the input channel as the rate-of-change channel is being generated. This allows rate-of-change to align in time with the original channel.
The derivative of left ventricular pressure (LVP) is illustrated in Figure 5. LVP was acquired from a Millar catheter-tipped miniature pressure transducer that was advanced into the left ventricle of the heart. The strength or speed of heart muscle contraction and relaxation is illustrated in the following derivative channels.
Channel d(LVP)2/dt (no filter) contains a significant amount of noise. However, channel d(LVP)7/dt shows the use of a 7-point balanced moving average filter to reduce derivative noise. Designing the filter as part of the derivative function reduces a two-step process to one, thus eliminating the need to filter the channel before generating the derivative.
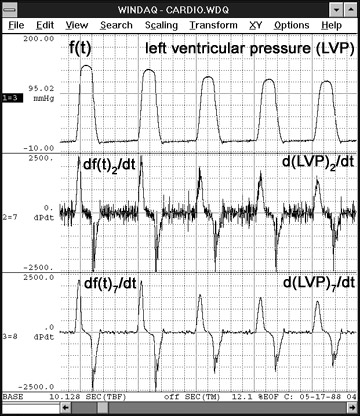
Figure 5 — Illustrates the Advanced CODAS differentiation function on a ventricular pressure waveform.
WAVEFORM MOVING AVERAGE FILTER — For Filtering Noise, Or For Generating A Mean Pressure Channel From A Phasic Channel
- Variable filter provides 2 to 1000 points of smoothing
The moving average filter of the derivative is provided as a separate function. This Iow pass-like filter can be applied to any input channel for noise reduction. It can also be used to generate a mean pressure channel from a phasic arterial blood pressure channel.
The end diastolic pressure channel of Figure 6 shows a 4x expansion of the LVP channel of Figure 5 without filtering. The next channel is the result of applying a 5-point moving average filter to the LVP channel to yield a clearer picture from which to derive EDP values.
The mean aortic pressure channel was generated from the aortic pressure channel using a 250-point moving average. The aortic pressure channel is from the same transducer used to generate the LVP channel, but before the catheter was advanced past the aortic valve into the left ventricle. The moving average filter factor was set equal to the sample rate of the aortic pressure channel. This approximates a one second time constant used in analog single pole Iow-pass filters to generate a mean pressure channel.
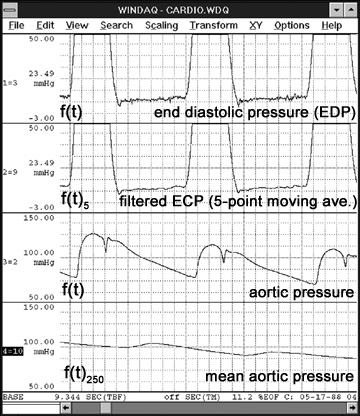
Figure 6 — Illustrates the Advanced CODAS moving average filter function on an aortic pressure waveform.
WAVEFORM MATHEMATICAL FUNCTIONS — For Combining Waveforms As A Function Of Arbitrary Mathematical Equations
- Supports +, -, ×, ÷, abs( ), exp, sqrt, log, and ln functions
- Supports waveform phase shifting in precise increments
- Automatic waveform calibration regardless of applied operations
Figure 7 is a print screen from the WinDaq Waveform Browser showing the result of a mathematical operation that generates an amplitude modulated (AM) waveform. The top two waveforms were acquired by WinDaq/Pro recording software. The two bottommost waveforms were generated mathematically using the Advanced CODAS mathematical functions utility. Channel 1 (topmost) is a carrier waveform. Channel 2 is a modulation waveform. Since the modulating waveform must not pass through zero to achieve proper modulation, channel 3 was derived by the mathematical functions utility by adding a fixed offset to channel 2's waveform. We display this waveform as an intermediate step for clarity. In reality, the offset may be specified as part of the formula that generates the AM signal of channel 4. Channel 4 is the AM signal generated by multiplying channel 1 by channel 3. Figure 8 is an FFT of the AM signal generated by WinDaq Waveform Browser playback and analysis software. The center peak of the FFT (the carrier frequency) is shown bracketed by upper and lower sidebands caused by the modulating signal.
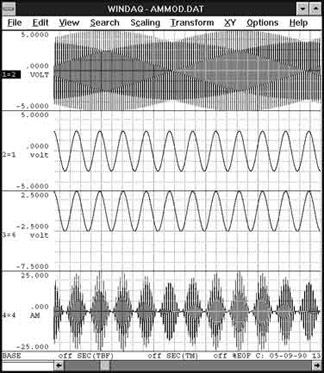
Figure 7
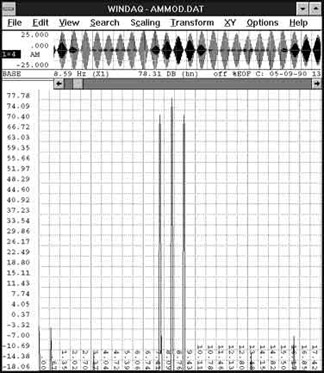
Figure 8
ADVANCED CODAS APPLICATION EXAMPLE
Background: The Ohio shore of Lake Erie is home to two nuclear power plants. Since it is also the home of a seismic fault, the NRC has established a seismological observatory to monitor earthquake activity in the area. Information from the observatory is disseminated to civil engineers as an aid for the design and maintenance of power plant structures.
Objective: To derive a measure of earth displacement from a WinDaq-acquired seismic velocity waveform resulting from an earthquake occurring 3/22/89.
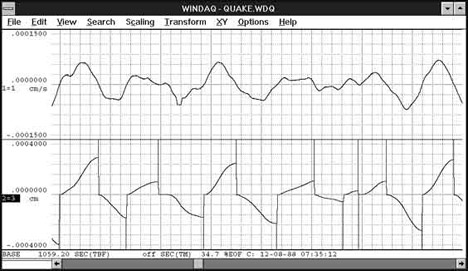
Figure 9
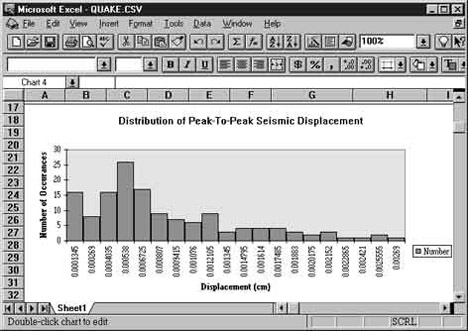
Figure 10
Procedure: The topmost waveform of Figure 9 is seismic velocity (cm/s). Using the Advanced CODAS integration utility, the second channel of Figure 9 (displacement in cm) was derived by integrating velocity with reset occurring at zero-crossing. Since maximum displacement in both the positive and negative directions of each seismic cycle occurs at the peak and valley points respectively, the waveform is passed through the Advanced CODAS peak and valley detector. Vertical markers placed on the waveform by the peak-capture software indicate the peak and valley points of each seismic cycle. The peak-captured waveform is passed through the Advanced CODAS report generator to produce an ASYSTANT-compatible file of maximum and minimum displacement values for each cycle. Figure 10 is a statistical distribution of peak-to-peak seismic displacement for the earthquake of 3/22/89 as generated by Microsoft Excel software.